Why on Earth Are We Still Using NPS?

Net Promoter Score (NPS) is a metric that has long captivated the business world. Its allure lies in its plain simplicity. It promises the capture of customer loyalty in a single number.
This perception is a double-edged sword—deceptively straightforward yet flawed in its ability to offer actionable insights.
A report by Harvard Business Review from 2021, Beyond NPS: Customer Experience Measurement Reimagined, quotes a study by Gartner:
"Research and advisory firm Gartner Inc. has predicted that more than 75% of organizations will abandon NPS as a measure of success for customer service and support by 2025"
Let's dissect the illusory effectiveness of NPS. We’re about to explore why its reign as the supreme metric for organizational success is misguided.
The Fallacy of the One-Size-Fits-All Metric
It's a story as old as modern business management.
A company, under pressure from various external factors like a recessive economy or new investors, scrambles to enhance its key performance indicators (KPIs).
The senior leadership, often newly appointed or restructured, is eager to make a significant impact. Their goal? To render the balance sheet irresistible to stakeholders.
Enter NPS— a single question lauded for its simplicity and ubiquity.
"On a scale from 0-10, how likely are you to recommend this company, blog post, or product to a friend or colleague?"
The results are compiled, and the survey is administered at different times throughout the quarter. The company solicits the reason behind each customer's score.
This marks the onset of a cascade of issues that the score alone could neither predict nor prevent. Projects spring up across the organization. Each quarter, the company religiously tracks the evolution of the score.
Yet, all is not well. Sales and product teams question whether the Net Promoter Score is the best metric to follow.
Management remains unyielding. It is the metric to adhere to.
As a result, people start to disengage and lose interest in the scoring process altogether.
This scenario is all too familiar for those who have faced and experienced implementing an NPS-based improvement system.
The simple question we should be asking is why NPS fails to meet expectations and help customer success.
What alternative metrics could serve us better in assessing customer satisfaction?
Sales and product development teams are left skeptical: Is NPS truly reflective of customer sentiment and revenue growth, or is it merely a superficial gauge that obscures deeper issues?
What is Net Promoter Score?
Understanding NPS
Net Promoter Score, commonly known as NPS, emerged as a game-changing metric intended to distill the labyrinth of customer emotions into a single, easily digestible number.
In 2003, consultant Frederick Reichheld unveiled the concept of NPS in his seminal Harvard Business Review article, The One Number You Need To Grow.
Reichheld's article made sweeping promises:
"After two years of rigorous research linking survey responses to actual customer behavior—purchasing patterns, referrals—and company growth, the results were clear, yet counterintuitive. A solitary survey question could serve as a meaningful predictor of growth."
NPS wasn't merely a tool to measure the likelihood of repeat purchases. No, this was about forging zealots—customers akin to Apple's diehard fans. These individuals don't just use your product; they evangelize it, passionately referring it to friends and family.

Calculating NPS
At its core, NPS is refreshingly simple to calculate. Customers are presented with one survey question:
On a scale of 0-10, how likely are you to recommend our company/product/service to a friend or colleague?
The answers are then grouped into three distinct categories:
- Promoters (9-10)
- Passives (7-8)
- Detractors (0-6)
To arrive at the Net Promoter Score, subtract the percentage of Detractors from the percentage of Promoters.
The formula is as follows:
Net Promoter Score = Percentage of Promoters - Percentage of Detractors
The NPS Scale and Interpretation
When interpreting NPS scores, the range extends from -100 to +100. Now, why the negative numbers?
They represent scenarios where Detractors considerably outnumber Promoters, essentially sounding a negative feedback alarm for immediate corrective action.
A score inching toward +100 is a business utopia where Promoters vastly outnumber Detractors.
In the corporate lexicon, this is a strong indicator for business leaders of customer happiness. It is also a potential indicator of revenue growth and market leadership.
Yet it's crucial to remember that this number is a call to continue innovating and delighting customers to maintain or improve that score.
What’s a 'Good' NPS Score?
The term 'good' is a subjective qualifier of NPS, mainly because industry norms can differ significantly. In some sectors, such as B2B companies, a score of -20 might be celebrated; in others, anything less than 10 could cause concern.
Yet, an accepted rule of thumb delineates that any score above 0 signifies that you're doing "good"—your Promoters outnumber your Detractors.
A score above 50 launches you into the "excellent" category, signifying a loyal customer base that can serve as brand ambassadors. But when you cross the golden threshold of 70, you're not doing well—you're excelling globally in customer loyalty.
Understanding the nuances behind these scores becomes invaluable in a landscape where customer opinions can make or break businesses.
What’s Wrong with NPS?
I would have given this article a different title if I didn’t have a bone to pick with NPS as a metric.
The Illusion of Scientific Credibility
Many businesses believe in NPS's supposed scientific rigor. They embrace it as the ultimate measure of growth and customer loyalty. But, academic research begs to differ.
A study by Tim Kiningham and colleagues in the Journal of Marketing sounded the alarm:
"Managers have adopted the Net Promoter Score on the premise that robust science backs the method, claiming it's superior to other metrics... We find no basis for the assertion that NPS is the 'single most reliable indicator of a company's ability to grow.'"
Moreover, many critics have targeted the NPS score and Frederick Reichheld's underlying method. They've highlighted a key issue: the lack of empirical evidence. It discards the fact that NPS can predict future behavior.
In short, the scientific underpinning of NPS isn't a rock-solid foundation.
Imbalance in Choices
The NPS is an 11-Point Scale from 0 to 10.
This might appear comprehensive, but it's skewed.
There are:
- Two options for positive feedback (scores 9-10)
- Two for passive (scores 7-8)
- Seven for negative feedback (scores 0-6).
This imbalance can bias the results, inflating the Promoter category. On top of that, it doesn't come with a manual for customers. How could they know the impact of answering the single-question survey?
The Flaws in Calculation
NPS categorizes customer sentiment by labeling scores from 0 to 6 as 'Detractors.' This is a significant flaw.
Equating a score of 6 (a lukewarm review) with a zero (a customer's cry for mutiny) lacks nuance. This broad-stroke approach muddles the data, stripping away any granularity in customer sentiment.
To spotlight this, let's delve into a simplified example:
- 5 people give your service a score of 0.
- 5 people give your service a borderline score of 6.
These two distinct groups get crammed into the same 'Detractor' bucket.
The NPS score for this group is -100. NPS mushes them together, blurring the lines and misleading your resource allocation.
We agree that a significant difference exists between a 0 and a 6. Same thing if ten people score the service at 6. The NPS will be -100.
Another quirk in the NPS framework involves scores of 7 and 8. It places respondents in the 'Neutral' zone. When crunching NPS numbers, the calculation formula excludes these ratings, contributing zero to the final tally—despite being above-average responses.
Let's sketch out a scenario with three customers:
- Customer A is reserved but optimistic, scoring 8 (Passive).
- Customer B hovers at a score of 7 (Passive).
- Customer C is an enthusiast, rating you with a 9 (Promoter).
Should Customer C slide their score back to an 8, your NPS tumbles from a stellar 100 to a flat zero. That's a seismic shift for a mere one-point tweak.
On the flip side, if either Customer A or B nudges their score up to a 9, your NPS rockets back to 100. This kind of volatility exposes the fragile nature of NPS, making it a vanity metric.
Questions of Predictive Power
NPS hangs its hat on the question, "How likely are you to recommend our product?"
This is a forecast, a speculation, a crystal ball question.
For those steeped in behavioral economics or psychology, you know the chasm between intention and action can be as vast as the Grand Canyon. What people say they'll do and what they pull the trigger on can be miles apart.
Consider this: You run a survey, and 60% of your respondents emerge as 'Promoters,' promising they'd vouch for your service. Fast forward a few months, and only half follow through. That 60% got slashed to a sobering 30%.
The Missing 'Why'
NPS gives you a score, a number, and a single data point.
It's not going anywhere until you dig deeper.
Imagine a customer hits you with a score of 6. Great, you've got a number—but why did they give it? Was it a glitchy interface, subpar customer service, or they didn't vibe with your brand? Not knowing the 'why' leaves you shooting in the dark.
NPS, as it stands, is a blunt instrument. It's like trying to sculpt a masterpiece with a sledgehammer. The artist will only get so far without the details. The critical follow-up question—"Why did you land on this score?"—is missing in action. It is a missed opportunity for actionable insights.
So here's the takeaway: Start seeing NPS as one piece of a more intricate puzzle of loyal customers and business growth. By diving into the motivations behind these scores, we elevate NPS from a blunt instrument to a precision tool. Then, we can drive improvements in customer experience.
The Metrics that Matter: What to Consider Instead of NPS
First things first—what are you aiming to improve? Knowing the answer to this question will guide your choice of metrics like a North Star.
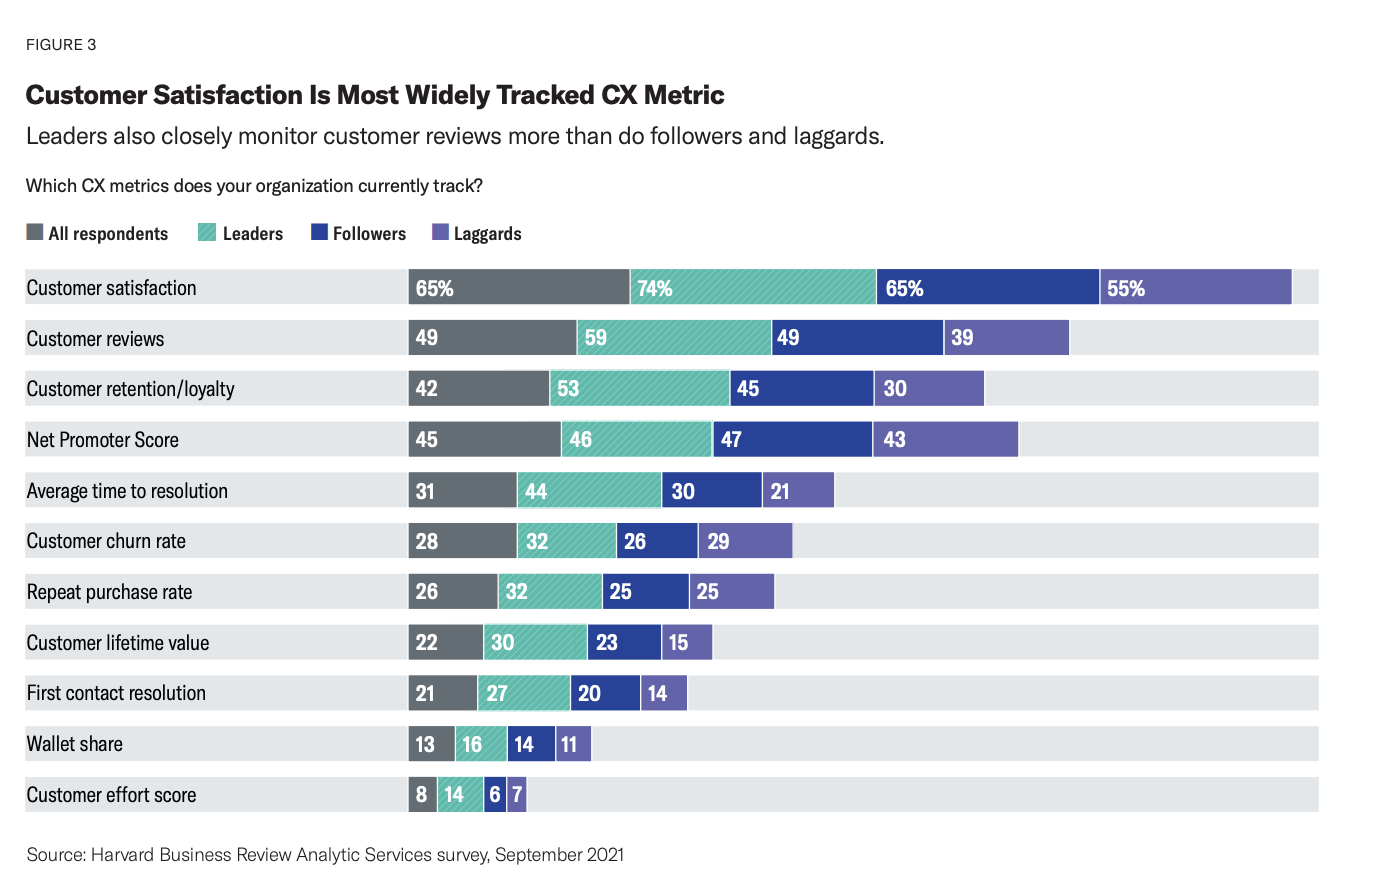
According to a study by HBR, the gold standard objectives for organizations revolve around tracking customer satisfaction, engagement, experience, and loyalty retention.
So, what exactly is your pain point?
- Organizational alignment?
- Cultural transformation?
- Data integration?
- Brand perception?
- Product experience?
- Operational efficiency?
- Customer support?
Before you pick a metric, check out the book "Lean Analytics." It's a game-changer for understanding what makes a metric impactful. Your metric should be clear, comparable, actionable, and behavior-focused. It should also be normalized—meaning it should be a ratio or rate to give context to raw numbers.
Now, let's talk about Netflix, a company that knows about staying ahead of the curve. They waved goodbye to NPS and rolled out a more nuanced approach. Instead of one sweeping question, they ask two specific ones tailored to their audience:
For current customers:
In the last six weeks, have you referred us to a friend or colleague?
For new customers:
Were you referred to us by a friend or colleague?
These questions offer a richer, more granular understanding of customer sentiment and behavior. And guess what?
You can do the same.
Remember, a metric isn't a number; it's a story.
And to tell a compelling story, you need more than a headline. You need context, nuance, and actionable insights. So ditch that NPS sledgehammer and pick a more precise tool to sculpt your customer experience masterpiece.
For more keen insights from smart product people, subscribe to The Product Manager newsletter.