Product Engagement: Are Users Loving or Leaving Your Product?

Have you ever worked for weeks on end to release a cool product with lots of shiny new features…and then nobody ended up using it?
Don’t worry, we’ve all been there! Although it might be an unpleasant situation to be in, it is not the end of the world. It’s also a pretty easy problem to fix.
The issue with your product is that it was not built with user engagement in mind.
As someone who has tackled product engagement problems many times in the past, I’m here to help you fix yours.
What Is Product Engagement?
Product engagement tells you how well your customers are using your product.
It is an umbrella term that includes both the metrics for measuring all of your customers’ interactions with your product as well as the set of tactics for improving them.
Active vs Engaged Users
Product engagement is a relatively new concept that has come to replace the outdated notion of “active users.”
In the past, product teams would measure the success of the product by the number of active users it had. Active users were the folks that would log into your product on at least a monthly basis, which would determine your MAU (monthly active users).
The problem with using logins as a measure of success was that not all logged-in users were valuable to you as a business. Many of them would rarely use your features and be very unlikely to convert to paid customers.
This is the problem that we soon learned to solve by measuring engaged users instead of active ones. Engaged users were the ones that were constantly using your core functionality and benefiting from them. It meant that they were happy with your product and would soon become paid users.
Now that we’ve covered the definition of product engagement, let’s move on to understanding its importance for your product.
Why Is Product Engagement Important?
Would you pay for a product that you are not using? You probably would if it was something you had signed up for and forgotten about. But you wouldn't want to build a SaaS business on the model of people forgetting to unsubscribe from your service, right?
The alternative is to make sure that your customers are constantly engaging with your product and enjoying their time using it.
Product engagement is one of the critical factors that drive product growth, increase lifetime value, and boost profitability (engaged users spend 60% more!) by improving product experience, increasing customer retention, and minimizing churn.
In fact, the most successful SaaS companies out there, such as Slack or Monday.com, are the ones that have perfected their customer engagement and made sure that a significant percentage of their customers are using their products on a daily basis.
Now that you know how important engagement is, let’s figure out how well your product is doing in that area by measuring your engagement.
How To Measure Product Engagement
Product engagement is a slightly-vague umbrella term and every team and company understands it their own way.
This vagueness might lead you to think that engagement is something hard to measure. However, the good news is, as long as you are clear with your definition of what “engagement” is for your product, measuring it is pretty easy.
Here’s a tried-and-true process for you to define and measure engagement.
Step 1: Define Your Key Actions
Your users are engaged if they are constantly using your product. We can define the term “using your product” as them performing certain actions inside your product.
These actions can vary significantly depending on your niche, size, and the use cases you cover. For instance, the engagement actions for a social network would be the following:
- Users post updates.
- Write comments.
- Like, Dislike, or “Heart” a post.
- Add friends or follow someone.
- Share somebody else’s post, etc.
This is vastly different from the case of an eCommerce store, where engaged users would:
- Search for products and view their description pages.
- Add items to their cart.
- Make a purchase, etc.
Therefore, your first step in measuring engagement would be to identify and list these key actions for your product.
But what if there are plenty of things that users can do, and I'm not sure which ones to track and measure?
In this case, your key actions should be the ones that bring the most value to the user.

Example of Key Actions
If you are using an email service like Gmail, what you care about the most is sending emails or reading the ones you have received. These two actions represent the points when you are experiencing value from the product.
Therefore, it is natural to track them, as the more you perform these actions, the happier you are with the product.
On the other hand, if we were to track the number of emails you have received, it would not really tell us how engaged you are as it might be a dead email account you never open that gets hundreds of spam messages a day.
Step 2: Prioritize your Key Actions
Not all actions are created equal. In the list of key actions that you have made, some might bring more value to your users than others. Thus, apart from making a list, you should also order it by importance.
Note: This prioritization will be quite handy later on when you have a bunch of underperforming areas in your product (e.g. few people commenting under posts) and you need to decide on which one to improve first.
To determine the value of each action on your list, you can use these tactics:
Data Analysis
If you already have some data at your disposal, try building regression charts between your actions and your business outcomes such as growth rate, revenue, or conversion rate. This way, you will be able to identify the actions that contribute to your business's success the most.
Example of Regression Charts
To illustrate this, let’s imagine you are leading a musical service app similar to Spotify and your team has identified two key actions—streaming a song and subscribing to an artist.
You want to understand which key action is driving the most free-to-paid conversions. For this, you can export the data into a simple spreadsheet and build two regression charts.
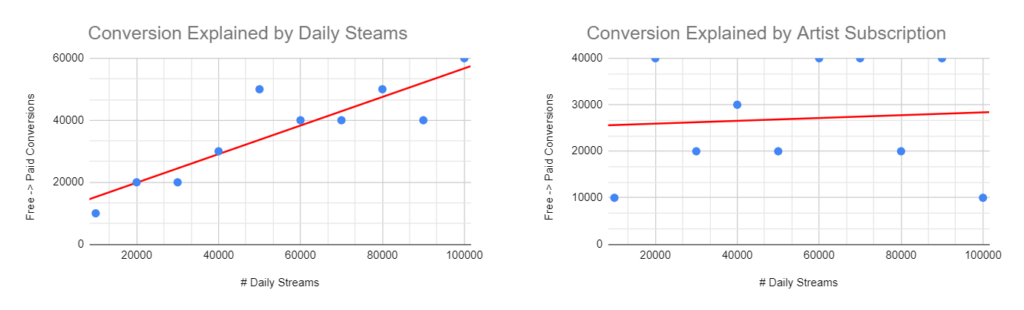
By analyzing these two, we can see that:
- The increase in daily streams also increases our conversion rate.
- The number of artist subscriptions does not lead to an increase in conversion.
Therefore, streams are superior to artist subscriptions as key actions.
Note: I made these charts using Google Sheets, but you can also use specialized data analysis tools like Tableau.
User Interviews
If you don’t have sufficient data to run analyses, you can choose the path of user interviews instead. After all, your goal is to prioritize your key actions by the value they bring to your users. So, why not ask them directly?
Some of the questions and tasks that you can give to your users to understand the perceived value of your key actions include:
- Making a list of key actions and asking users to order them according to perceived importance.
- Using the same list above, but asking users to pick the three that are the most important to them.
- Asking how they would feel if we suddenly removed that feature/action from our product.
Note: Although all three can give you valuable data, from my experience, the third one gets you the best insights, as customers start explaining why they need that feature.
Step 3: Define Your Engagement Metrics to Measure the Performance of These Actions
Now that we have a list of actions worth tracking, our next step would be to define the metrics that we want to track for each of these key actions.
The question here is, if your key action is streaming music, do you want to calculate the total number of music streams, the average rate per month, or the percentage of streams that have reached the end of the song?
To tackle this challenge, I recommend using the BDF framework. This framework states that each key action has four groups of metrics that are worth tracking—Breadth, Depth, and Frequency (hence, BDF).
Example of BDF Metrics Groups
For the case of music streaming, our metrics would be:
- Breadth: The number of users that stream music every day (a.k.a DAU).
- Depth: Average number of daily streams.
- Frequency: Percentage of weekly streaming users that also stream every day (a.k.a DAU/WAU or stickiness).
Another important metric to track is AHA! moment conversion rate. Your users reach their AHA! moment when they first experience the value of your product. For our streaming example, users will reach their AHA! moment when they find the song they love and start streaming it.
To calculate AHA! moment conversion, simply divides the number of users who have reached it by the total number of users in your product.
Step 4: Get Yourself an Analytics Tool
We are done with most of our preparation and can finally get to the tracking itself. But before discussing the process of setting up an analytics tool, let’s take a closer look at how the theory works.
In the world of software, tracking/analytics works the following way:
- Your users perform an action inside your product (e.g. start a stream).
- There is a special code in your product that fires an event (e.g. a user just started a stream) and sends that data to the analytics tool.
- The analytics tool stores that event under the appropriate user’s section in its database.
- You build a chart in your analytics tool, configuring it to show some sort of valuable information (e.g. the number of daily active streamers over the last month).
- The analytics tools retrieve the relevant data, perform calculations, and draw the chart for you.
As evident from this process, after we have bought and set up the analytics tool of our choice (e.g. Mixpanel or Amplitude), we will also need to ask our engineering team to write the code that will fire the events.
For this, I recommend creating a tracking plan and sharing it with the engineers.
Example of a Tracking Plan
Here is what a tracking plan (the template I love using) looks like:
The tracking plan will serve as your single source of truth for everything related to analytics, and, apart from serving as a requirement for your engineers to develop the code for firing the analytics events, this document will also be immensely handy when maintaining or editing your analytics code.
As soon as the code is ready and we can see the events appearing in our analytics tool, we can move on to building our reports and dashboards.
Step 5: Build Your Engagement Reports
Modern analytics tools provide a wide variety of charts and reports to choose from. Some of the reports that I have found handy include:
- Ordinary Charts: This is the plain chart that you can build for any event. This is what you use to track your DAU over time.
- Segmented Charts: This type of report helps you compare cohorts of users by their performance (e.g. the average number of streams per day for free users vs pro users).
- Funnels: With funnels, you are able to investigate your user journey and find any spots where their experience breaks.
Example of an Engagement Chart
There are also reports that are purpose-built for measuring engagement, such as Amplitude’s Engagement Matrix which gives you an overview of the breadth and frequency of your key actions. Here is what it looks like.
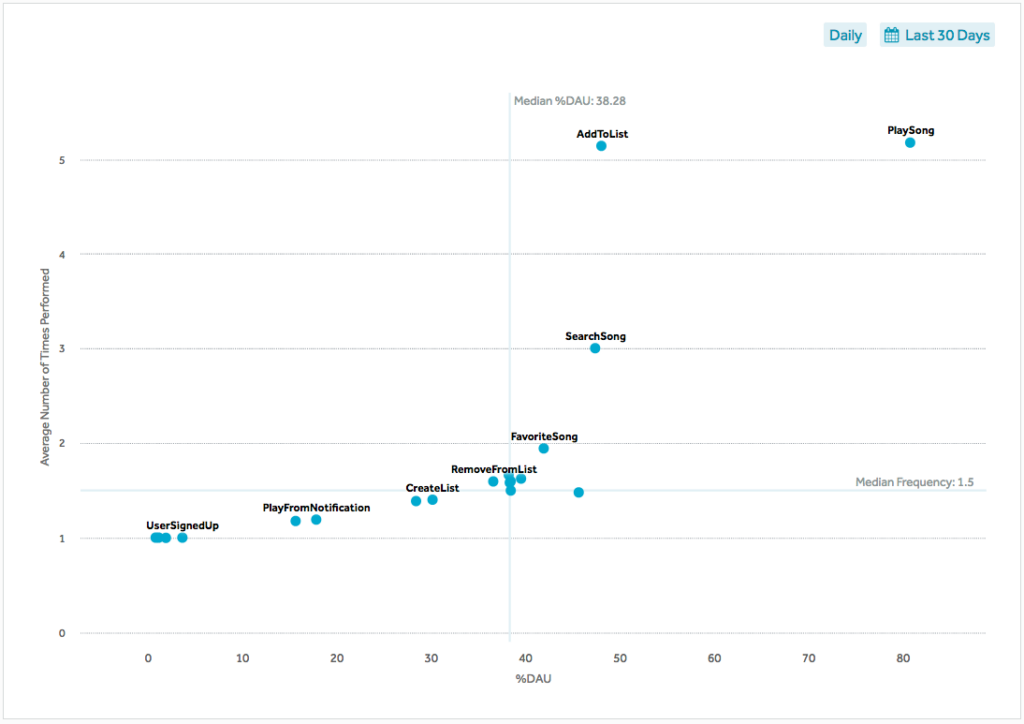
By examining the report here, we can conclude that the PlaySong feature is the one that users engage the most with as it has a higher-than-average DAU percentage as well as a higher average frequency.
That covers setting up and tracking product engagement. Now our next steps would be to analyze the reports we have built to find issues with engagement and fix them.
How To Improve Product Engagement
Don’t get discouraged if you find out that many of your features underperform significantly. This is something that every product has experienced at some point in its lifecycle.
Instead, start focusing your attention and resources on fixing these issues and making sure that your users love returning to your product.
What to Do if Your Product Engagement Sucks
From my experience, features have a low engagement for four major reasons:
- Bad discoverability.
- Bad AHA! moment conversion and onboarding experience.
- Bloated user interfaces and workflows.
- Bad customer support.
Working with customer success teams is a story for another day. So let’s focus on the other three and see how we can fix them.
Optimize Feature Discoverability
Most of the time, the majority of your user base will simply have no idea that you have released a new feature. Not all of them read your release notes or the emails you send to them with feature announcements. Therefore, you need to bake discoverability into your product UX and come up with in-app solutions.
To do it, you will need to solve two key user experience issues:
- Make sure your users see your new feature and it's not hidden out of sight.
- Making sure that they use it at least once so that they know what your new feature is about.
Now let’s demonstrate how products fix these issues using Slack as our example.
To let you know that you can connect your Slack account to Google Drive, Slackbot will send you an in-app message on the channel where you have posted a drive link.
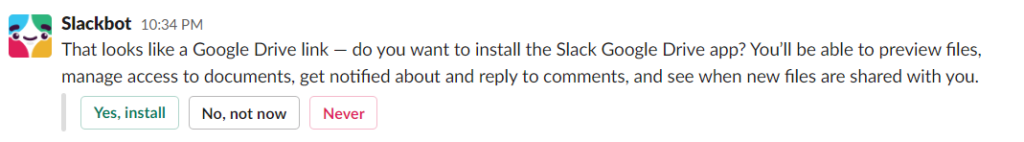
Slack has done a great job at implementing this approach because it proactively tells you that there is a Google Drive integration feature. By doing it in the chat where you have just sent the link, they are making sure that you have seen it (unlike their email that you might have ignored in your spam-laden inbox).
They are also significantly increasing the chances of you clicking on it and using it, as they tell you about the feature at a point in your customer journey when you are most interested in trying it. Again, even if you read about it in their monthly newsletter, the chances are high that you would have forgotten about this feature the next time you opened Slack.
Get to the AHA! Moment as Quickly as Possible
If your users have to spend hours (or even 30 minutes) going through 10-20 steps to experience the key value of your SaaS product, the vast majority of them will quickly lose interest and drop before reaching their AHA! moment.
Therefore, it is critical for you to shorten the period of time and the number of steps your users take to reach their AHA! Moment.
To get an idea of how others have solved this problem, let us check out Bit.ly, the URL-shortening service that many of us use constantly.
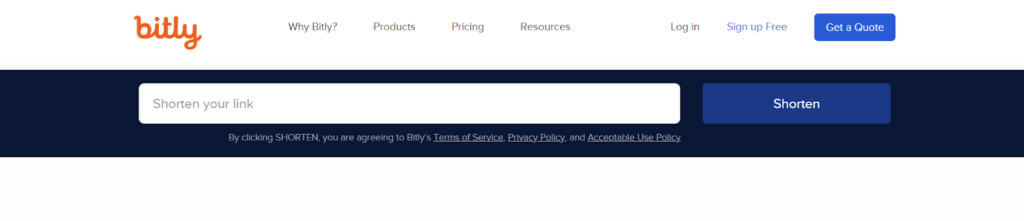
Instead of making their users sign up for the service and go through a lengthy onboarding process, they have placed the URL shortening feature right on their homepage.
This way, Bit.ly made sure that its users immediately reach their AHA! Moment by shortening their links with a single click.
Kill Underperforming Features and Debloat Your App
Sometimes the reason people do not notice or use your features is the abundance of many other features on your UI. If there are too many of them, your users will grow to ignore them and only notice the ones they use constantly.
Therefore, it is always a good idea to debloat your UI and sunset some of the features there. To decide on the list of features that you want to let go of, you can use your prioritized list of actions and your engagement reports.
The prioritized list will contain everything that you should not touch as they are bringing value to your users, while your engagement reports will show you which features are performing far below your threshold.
Keep Things Interesting
Keeping your new users engaged will quickly translate into sustainable productivity growth. Luckily, there are lots of well-tried tactics out there to measure and improve your product engagement.
But product engagement is only one of the aspects that are worth improving. You should also pay attention to:
- Getting your product vision and strategy right.
- Setting up the processes for obtaining meaningful user feedback.
- Managing your stakeholders and keeping everyone happy.
And for more product management wisdom and resources, don’t forget to sign up for our newsletter!