4 Service Design Artifacts Product Teams Can Use To Find Flaws And Fine-Tune Features
Product managers are often seen as the mini-CEOs of their products, which is why they need to be able to look at a problem from multiple lenses in order to make decisions.
There’s no shortage of product management tools in the world, including analytics reports, project management tools, business snapshots, and industry reports. However, none of these tools are as collaborative and as in-depth as the artifacts taken from the world of product and service design, both worlds built upon the design thinking framework.
These design-thinking tools allow product managers to visualize the problem, look at it from multiple angles, and collaborate with many different stakeholders from the business side, as well as the more technical fields on creating solutions.
This article will explain what these visual artifacts are and how they can be leveraged to make better decisions with a diverse group of stakeholders.
These artifacts can be prepared by service design or business design professionals, or by any product manager trained in these disciplines.
Let’s dive right in.
A Few Reasons To Use Service Design Visual Artifacts
A picture is worth a thousand words
It’s a well-known fact that our brains process images much better than text. Images and visual artifacts help with memory retention and help to explain complicated concepts faster.
The service design artifacts presented in this article are all visual, and they help to simplify complex problems and explain them quickly within the boundaries of one visual artifact.
If you’re a busy product manager, you’ll appreciate these visual tools because of the simplicity they bring to the world of complexity and ambiguity you operate in. Moreover, the product management world is already using visual tools such as user-story mapping to improve backlog prioritization, and if you’re comfortable with them, you’ll immediately understand the value of visual artifacts used in service design.

Frame the entire problem you need to solve
Anyone who works in business-related and strategy positions can testify that sometimes, due to the lack of information, they are only able to tackle symptoms rather than the root cause of a problem.
Service design artifacts such as customer journey maps and service blueprints allow you to frame the entire problem by visualizing what’s visible to customers—like UIs, service employees, et cetera—and what’s behind the “line of visibility” or the backend—such as systems and processes. Once the entire ecosystem is visualized, it's much easier to spot problems and fix them.
Collaborate more closely with different stakeholders
The process of creating most of the service design artifacts described in this article is collaborative and involves running workshops with many different stakeholders.
This way, you can all align on the same vision and strategy while creating shared artifacts, which you can always refer back to when you start to create solutions.
Nowadays, it’s easy to do this with anyone anywhere in the world, due to the rapid popularity of digital boards and digital tools for workshops and collaboration.
Look at the current and the future states of your solutions
In some cases, to tackle ambiguous problems you’ll need to review the current state of your existing solutions, and sometimes you’ll need to prototype a future state.
Service design visual artifacts, including the business model canvas, customer journey maps, ecosystem maps, and service blueprints allow you to do both of these things according to your needs.
You can use them to review the current state of your solution and take a “baseline” snapshot, identify pain points and weak links in the system, and prototype future products and services.
4 Common Artifacts and How to Use Them
There are quite a few options to choose from when it comes to visual artifacts used by service and business designers. The important thing to remember is that they each serve a different purpose.
Here are some of the most useful visual artifacts you can add to your toolbelt.
Ecosystem Maps
Why They're Useful: There are cases where you need a general understanding of the ecosystem your product operates in, especially at the beginning of projects when you want to get a holistic picture of what’s involved in your product’s success.
Ecosystem maps help to visualize and understand the relationships and dependencies between the various actors and parts of the system that contribute to creating a good product and a good customer experience.
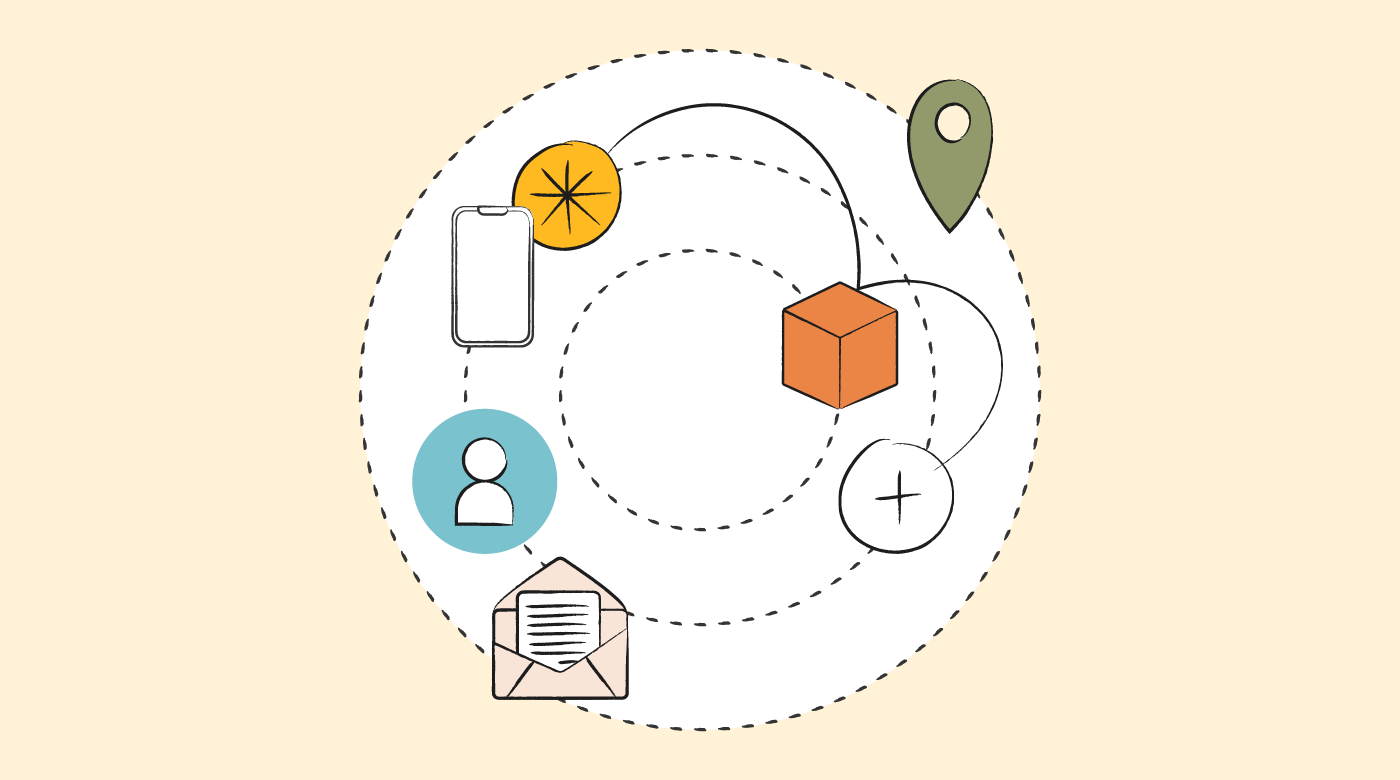
How They Work: You can think of an ecosystem as actors, parts, and dynamics. The maps reveal areas to optimize in the system. Let’s look at the components individually:
- Actors - Any employees that are involved in delivering a continuous experience of a product or service such as support agents and customer success
- Parts - Devices used by customers (e.g. smart phone, voice user interface, etc.), and other technological components such as a website, app, and hidden components such as databases, etc.
- Dynamics - The interactions between actors and parts such as information sharing, processes, etc.
I have used this visualization in the past to help a non-profit startup in the field of sustainable solutions to understand and envision the dependencies in their future ecosystem. I found it to be very useful to lead a discussion where we were able to visualize some dependencies that were a bit unclear to the team.
In situations like this, where you do need to have an informed conversation about dependencies, present, and current ecosystems, an ecosystem map is a very powerful tool to align everyone on all the moving pieces that enable a service.

How to co-create an ecosystem map with your stakeholders
- Invite a group of 4-5 diverse stakeholders to the meeting (e.g. engineering, design, customer success, business partner, etc. )
- Provide everyone with a large piece of blank paper and writing implements.
- Instruct everyone to start creating a diagram by writing the organization's product or service in the middle of the paper.
- Next, instruct everyone to draw a ring outside the center circle and add the most important actors and parts for the operation of the product inside of it.
- Ask participants to then add another circle around the previous one and draw other dependencies (actors and parts) inside the outer circle.
- Ask everyone to trace the relationships between all the actors and parts in their diagram.
- Compare the results and come up with a unified version based on everyone’s knowledge.
By following this process, you’ll be able to find blind spots and leverage the power of the crowd. Make sure to start with the current state and then map out a version representing the desired future state.
If you’d like to talk about adding a future product to the existing ecosystem, you can repeat the process—this time drawing the future state.
You can also use this output to feed into another visualization artifact—the service blueprint—which we’ll cover later.
Business Model Canvasses
Why They're Useful: There are times when you need to document your business model or plan for a new one. Enter the business model canvas.
This is a great tool to visualize entire business models on one slide and to help align everyone’s understanding of them by letting them see the ins and outs of the business model visually.
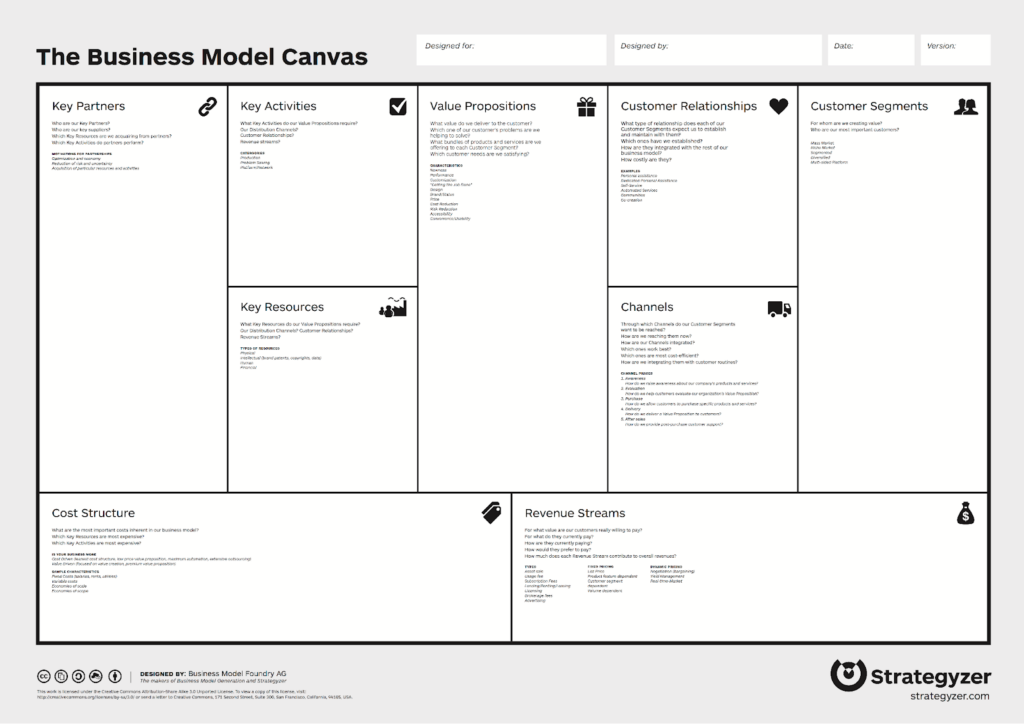
How They Work: Business model canvasses typically have 9 areas:
- Key partners that enable the service
- Key activities needed to enable the service
- Key resources needed to enable the service
- Value proposition for your customers
- Customer relationships established by each segment
- Channels you use to deliver the service
- Customer segments that make up your target market
- Cost structure that outlines how people will be charged
- Revenue streams that indicate how money will flow in
I’ve recently seen a version from the Interaction Design Foundation where they suggest an additional part for Sustainability due to the ambitious goals of countries around it in recent years. In this space, you’d mention how you'll make sure the service doesn’t create negative impacts on our society and the environment.
I personally think that it’s a powerful tool to involve business partners in product conversations, because you focus a lot on the revenue streams and cost structure beyond the product itself, and there’s an opportunity for everyone to contribute to a product that can yield better results for the business while providing a better customer experience.
How to co-create the business model canvas with your stakeholders
- Invite a group of 4-5 diverse stakeholders to the meeting (e.g. engineering, design, customer success, business partner, etc.)
- Make sure you have at least one facilitator, and one subject matter expert (SME).
- The facilitator should give an overview of the workshop, and explain what each area of the visualization means.
- Let the SME walk through the current or future business model for 10-15 minutes.
- Once the SME has finished walking everyone through the information, let the participants add sticky notes to the different parts of the visualization based on what they understood. Do it quietly for about 10 minutes so they can brainstorm while avoiding “group thinking.”
- Let the facilitator start a discussion about each part of the chart individually. This is where you’ll collectively understand where your knowledge gaps are.
- If there are knowledge gaps, make sure to create action items to try to address them.
The business model canvas is a great way to get that holistic view of an existing business model and prototype the value proposition of a future business model together with a group of stakeholders that can help you address your own blind spots as a product manager.
Customer Journey Maps
Why They're Useful: If you need to uncover opportunities to optimize the end-to-end experience of your product (website, app, or parts of them) customer journey maps can help you do just that.
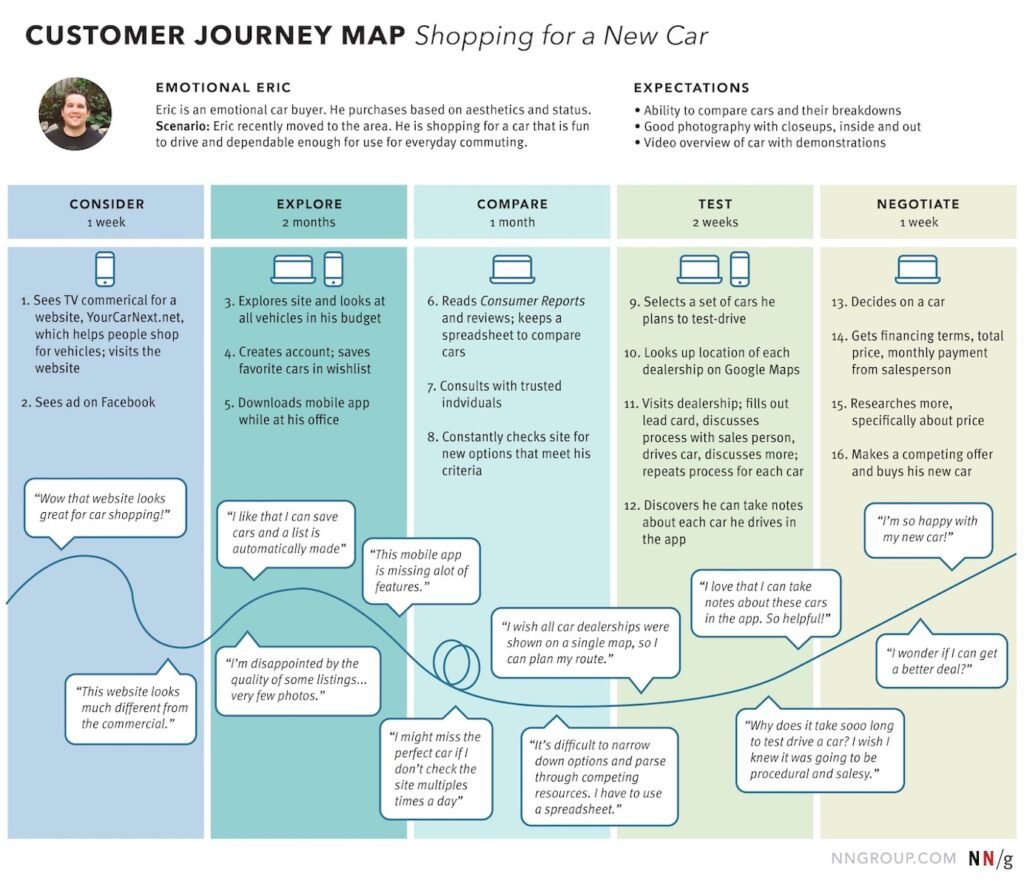
A customer journey map is a visual representation of your customer journey seen from a customer's point of view. Companies use this visualization to find friction points that they can improve.
How They Work: In the past, I used it in a startup in the field of music technology to map the entire customer journey for two personas and understand what it feels like for them—from becoming aware of the product, to turning into a loyal customer.
The startup had a few product lines, but to make the most out of this artifact we chose the most mature product line, and after generating the map based on real customer interviews we conducted a brainstorming session to identify opportunities for improvement and potential solutions at different touchpoints.
It was particularly interesting for me to be able to show that different personas experience the customer journey in a very different way and as a result, need very different solutions.
How to co-create a customer journey map with your stakeholders
- Start by focusing on one customer persona.
- Next, choose the scope of the experience you want to visualize (e.g. the entire journey or just the website customer journey, etc.)
- Review any relevant customer data you have about each stage of the journey, preferably both qualitative and quantitative.
- Next, conduct a workshop with your stakeholders to identify solutions for the friction points you uncovered.
Customer journey maps are an artifact that can be used to visualize future or current states. If you’d like to visualize a future state, I recommend co-creating it with a diverse stakeholder group. You’d pretty much repeat the same process I outlined for the previous visualizations—letting everyone create their own version of the map, and then creating a unified version.
Make sure, once your solution is out in the world, to repeat the process mentioned for mapping the current state to validate the map you co-created. Also, it’s recommended to repeat the process about once a year since things can change a lot within 12 months. You always want to maintain an up-to-date map that can help you with the current year's product roadmap and sprint backlog.
Service Blueprints
Why They're Useful: A service blueprint is an extension of both the customer journey map as well as the ecosystem map.
It can be very handy for creating an in-depth view of what enables certain customer interactions (or customer touchpoints) both in the front end and the back end.
Service blueprints can help you improve the experience of both your clients and your internal employees who support the service by deeply understanding both worlds. Service designers really like this tool because it is particularly useful to help break silos in the organization to ensure a good user and employee experience.
How They Work: As mentioned, service blueprints can be particularly helpful in areas where you have human employees handling some aspects of the process or product.
For instance, onboarding processes in B2B companies usually involve humans (either automated emails that put you in touch with account managers) or more involved processes with implementation managers. Service blueprints can help you visualize the process and find opportunities to make it better for your customers and employees.

How to co-create a service blueprint with your stakeholders
- Start with a paper or digital board and draw a line in the middle (representing the line of visibility) that divides the area into two areas representing the front and back ends.
- Ideally, the next best step is to conduct a listening tour of your product with all the functions in the company that are involved in front-end and back-end operations to understand all the moving parts.
- During the tour, map all the touchpoints, actions, interactions, processes, and technologies.
- Next, take a look at the map from your customers' perspective and identify any points of friction that merit a solution.
A solution might be fixing something in the backend (e.g. a process, a table in the database, etc.) and not necessarily introducing a new feature. This is what makes this visual artifact unique. It makes you think holistically. After creating it, you can bring your stakeholders for a workshop and think together about potential solutions.
If you’d like to prototype a future service you’ll have to do it with a diverse stakeholder group. You’d pretty much repeat the same process I outlined for all the previous visualizations—letting everyone create their own version of the service blueprint, and then creating a unified version.
This time, you’ll draw on your experience in creating both the ecosystem map and the customer journey map to give you that holistic view of future service.
Take Advantage Of The Tools
By now, you've had the chance to understand some of the tools of the service design craft that can be very useful and applicable in the world of product management.
The tricky part is figuring out when you should use which tool, and there are many great resources online to help you achieve that level of proficiency.
If you’d like to learn more about creating journey maps and service blueprints I recommend this course from the Interaction Design Foundation.
If the concept of design thinking intrigues you, check out our roundup of the best design thinking podcasts.
To learn more about service design in general, I recommend the book “This Is Service Design Doing” by O’Reilly.
And of course, if you’d like to receive more helpful articles like this to your inbox, subscribe to the Product Manager newsletter.